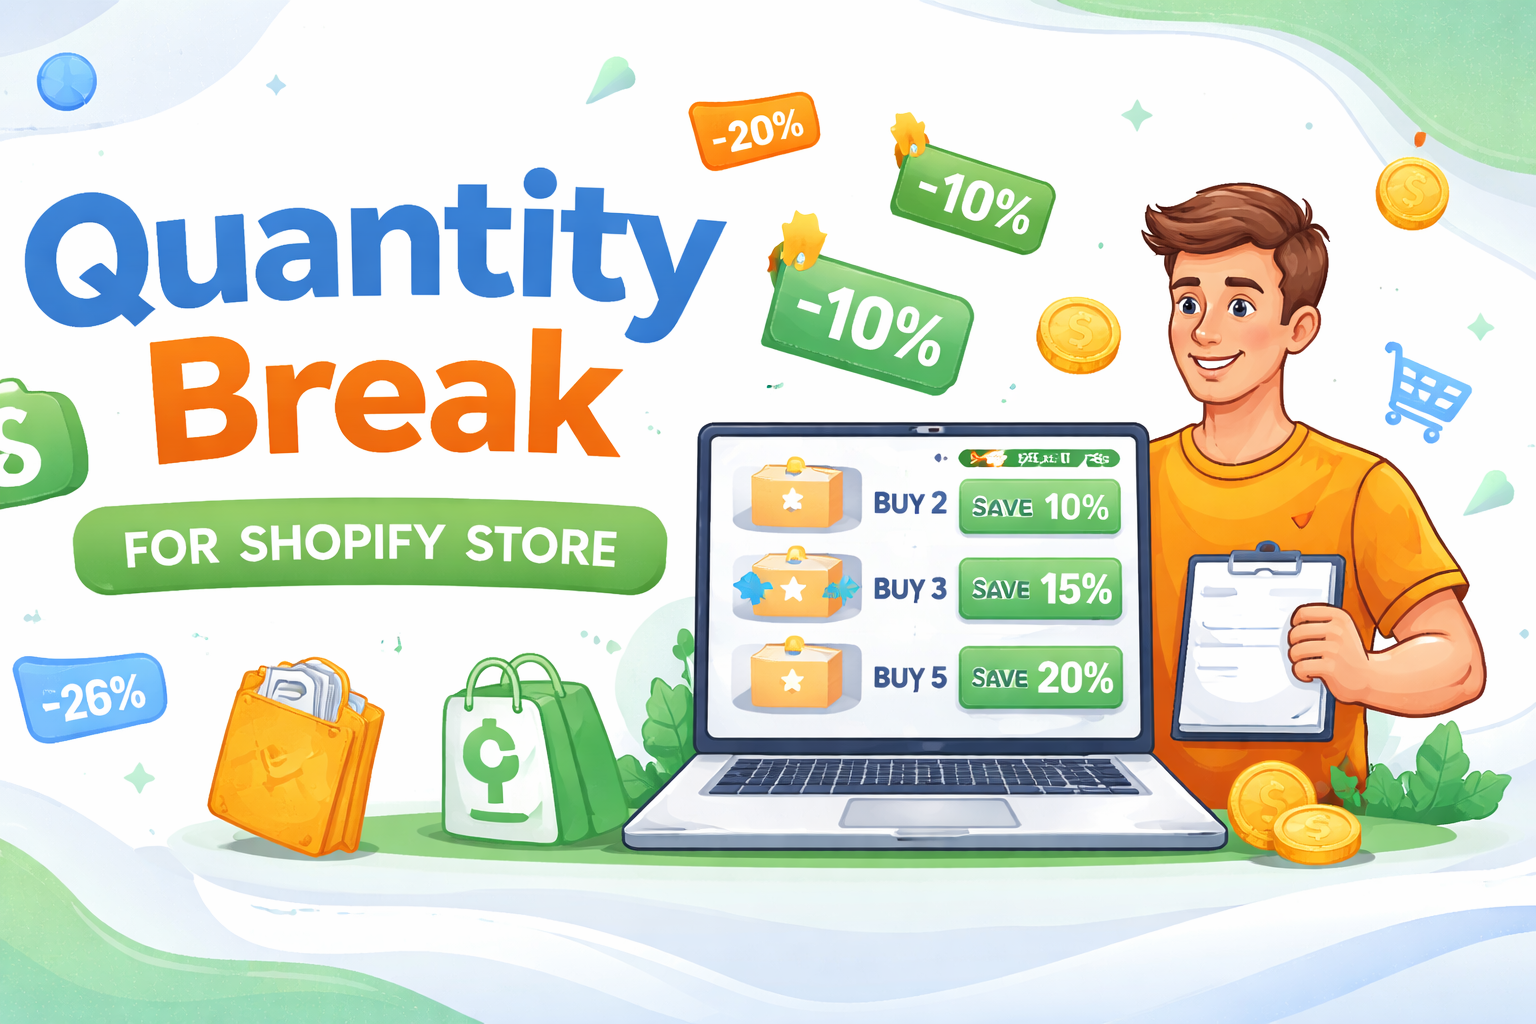
Quick Answer: How to Increase Sales with Quantity Breaks
To increase sales with quantity breaks on Shopify, build a three-tier pricing structure with a 10% / 15% / 20% discount ramp, place the pricing table above the add-to-cart button, anchor the middle tier with a "Most Popular" badge, stack a free-shipping threshold just above the target tier, and use a progress bar to trigger completion bias. Stores following this framework typically lift AOV 20–35% within 30 days, with consumables reaching 68%.
A customer lands on your product page. They want one of what you sell. They add one to cart and check out. You made the sale — but you also left 30% of the order on the table.
That gap is what quantity breaks close.
A 2026 analysis of Shopify merchants using strategic tiered pricing found AOV lifts ranging from 15–27% on apparel to 68% on consumables — often inside the first month. The math is brutally in your favor: when you sell one extra unit at a 10% discount, you're not giving up margin, you're creating revenue you'd never have captured.
But quantity breaks don't print money on their own. The structure matters. The placement matters. The pricing psychology behind why a tier converts matters most. This guide is the 11-step playbook that separates stores seeing a 5% bump from stores doubling their basket sizes.
What Is a Quantity Break? (Definition)
A quantity break is a tiered pricing offer that reduces the per-unit price of a product as the customer buys more units. Also called volume discounts, tiered pricing, bulk discounts, or "buy more, save more" deals, quantity breaks are displayed as a pricing table on the product page (for example: 1 unit at $25, 3 units at $21.25 each, 5 units at $20 each).
They are used by Shopify merchants to lift average order value (AOV), accelerate inventory turnover, and reward larger purchases — without running sitewide promotions or eroding brand-level pricing. New to the concept? Start with our plain-English explainer: what are quantity breaks?
Key Takeaways
- Three tiers, always. Two doesn't create enough upgrade pressure. Four overwhelms.
- 10% / 15% / 20% is the proven ramp. Below 10% feels meaningless; above 25% trains customers to wait for the deal.
- Anchor the middle tier. A "Most Popular" badge on the target tier lifts its selection rate 25–35%.
- Stack the levers. Quantity break + free shipping threshold + progress bar outperforms any single mechanic by 2–3x.
- Mobile-first placement. 70%+ of Shopify traffic is mobile. If your pricing table requires scrolling past the price, most shoppers never see it.
- A/B test thresholds, not just discounts. Moving the first tier from Buy 2 to Buy 3 can swing AOV ±15% depending on your category.
- Margin gate: 40%+ gross. Skip quantity breaks on products with less than 40% gross margin or on loss-leader items.
Why Quantity Breaks Work: The 5 Psychology Levers
Quantity breaks aren't effective because customers love math. They're effective because they trigger five overlapping psychological mechanisms — all at once, on the same product page.
1. Perceived Value (Anchoring)
The original price becomes an anchor. Once shoppers see "$25 each / $22 each at 3+", the $22 price feels generous — even though they showed up willing to pay $25. The discount manufactures value where none existed ten seconds earlier.
2. Loss Aversion
Daniel Kahneman's research shows losses feel about 2x more painful than equivalent gains. A tier table doesn't just offer savings — it implies you'll lose savings by not upgrading. "You could be saving 20%" is a stronger nudge than "Save 20%."
3. Completion Bias (Goal Gradient)
Progress bars exploit the goal-gradient effect: humans accelerate effort as they approach a goal. "You're $12 from unlocking 20% off" reframes the next unit not as more spending, but as closing a gap. This is the same mechanic Duolingo uses to keep streaks alive.
4. Choice Architecture
Three visible tiers don't just offer options — they redefine "normal." Without a tier table, buying one unit feels normal. With three tiers and a "Most Popular" badge on the middle one, buying three units feels normal. The product didn't change. The reference point did.
5. Status Signaling (B2B)
In wholesale and B2B contexts, choosing the volume tier signals planning, resourcefulness, and economic sophistication. Buyers feel competent for unlocking the bulk deal — even though it was sitting in plain sight on the page.
Every tactic below activates at least one of these levers. The stacking is where the magic lives.
How Much AOV Quantity Breaks Add (2026 Benchmarks)
Short answer: Shopify stores with well-built quantity breaks see a 20–35% AOV increase within 30 days. Consumables and basics often reach 68%. Aggressive structures on digital products can push 50%+.
Here are the verified benchmarks from 2025–2026 industry data:
| Product Category | Typical AOV Lift | Top End |
|---|---|---|
| Consumables (supplements, coffee, skincare) | +25–35% | +68% |
| Apparel basics (tees, socks, underwear) | +15–25% | +40% |
| Beauty & cosmetics | +20–30% | +45% |
| Pet products | +25–35% | +55% |
| Digital / print-on-demand | +30–50% | +80% |
| B2B / wholesale | +18–28% | +45% |
| High-ticket goods (>$200) | +8–15% | +25% |
Three additional benchmarks worth knowing:
- Conversion rate: well-placed pricing tables lift CVR 3–8% (Atom Commerce, 2026)
- Inventory turnover: up to 40% reduction in excess inventory costs (Appstle, 2025)
- Time to results: most stores see measurable lift within 7–14 days of going live
1. Design Tiers From Basket Data (Not From Vibes)
The biggest mistake stores make: setting tiers on intuition. "Let's offer Buy 2, Buy 5, Buy 10." Why those numbers? Usually because they're round.
Open Shopify Admin → Analytics → Reports → Units per order. Look at the distribution of order sizes for the product you're optimizing. You're hunting for cluster points.
If 60% of orders are 1 unit and 25% are 2 units, your entry tier should be at quantity 2 — the easiest upgrade for the largest pool of buyers. If 50% of orders are already 2 units, your entry tier needs to start at quantity 3; otherwise you're paying a discount on sales you'd already be making.
The Tier-Setting Rule
Each tier threshold should sit one unit above a natural cluster point in your basket data. Tier 1 catches the easy upgraders. Tier 2 stretches them. Tier 3 captures the power buyers you'd otherwise lose.
2. Use the Rule of Three
Three tiers. Not two. Not four. Three.
Two tiers feels like a binary choice with no upgrade pressure. The customer picks the cheaper option (one unit) and moves on. Four or more tiers triggers the paradox of choice — decision fatigue causes shoppers to default to the safest pick, which is almost always the smallest quantity.
Three is the sweet spot because it creates:
- An entry tier (low commitment, easy yes)
- A target tier (where you want most buyers to land — anchor it)
- An aspirational tier (rarely chosen, but it makes the target tier look reasonable)
The aspirational tier earns its keep even if almost nobody picks it. Its job is anchoring. A $50 / $90 / $140 tier set makes $90 look mid-priced. Without the $140 anchor, $90 feels like the premium option.
3. Anchor the Middle Tier With a "Most Popular" Badge
If every tier in your table looks the same, customers default to tier 1. The smallest commitment wins by default.
Add a single visual highlight — a colored border, a "Most Popular" badge, a "Best Value" tag, or a contrasting background — on the tier you want to win. This isn't a trick. It's removing decision friction. Shoppers want guidance, and a labeled "popular" choice gives them permission to upgrade.
Stores that A/B test "Most Popular" badges on the middle tier typically see that tier's selection rate jump 25–35% versus an unbadged control.
Badge copy options (ranked by category)
- "Most Popular" — social proof framing. Best for consumables and lifestyle products.
- "Best Value" — economic framing. Best for B2B and value shoppers.
- "Save $X / order" — outcome framing. Best when dollar savings are eye-catching.
- "Recommended" — soft authority. Works in skincare, supplements, and curated categories.
4. Stack a Free-Shipping Threshold Just Above Your Target Tier
Quantity breaks pull shoppers up the tier ladder. Free shipping thresholds pull them past a number. Combined, they create a one-two punch most stores never set up correctly.
Set your free shipping threshold just above the cart total at your most-popular tier. Example:
| Quantity | Total | Status |
|---|---|---|
| 1 × $25 | $25 | — |
| 2 × $22.50 | $45 | Tier 1 (10% off) |
| 3 × $21.25 | $63.75 | Tier 2 (15% off, Most Popular) |
| 4 × $21.25 | $85 | Free shipping unlocks at $75 |
| 5 × $20 | $100 | Tier 3 (20% off) |
At quantity 3, the customer is $11.25 from free shipping. The framing isn't "spend $11 more." It's "you're so close." That single line of copy is worth 8–15% extra AOV.
5. Add a Free Gift at the Top Tier (Reciprocity)
The top tier needs a non-monetary reason to choose it. Otherwise the math just gets weaker as the discount caps out. A small free gift — a $5 add-on, a sample, a branded sticker pack — triggers reciprocity: the customer feels they're getting something rather than just buying more.
Pick a gift that costs you $2–$5 but feels worth $15–$20. Sample-size product. Branded pouch. Limited-edition packaging. The perceived value matters more than the actual cost.
Stores adding a free gift to the top tier typically see top-tier conversion lift 18–25%. The gift converts shoppers who were on the fence between tier 2 and tier 3.
6. Use Progress Bars to Trigger Completion Bias
A static pricing table tells customers what's available. A progress bar tells them how close they are.
"You're $12 from unlocking 20% off" is doing two things at once:
- Quantifies the gap — removes the math anxiety of "how much more do I need?"
- Triggers loss aversion — the discount feels owed, and not buying means losing it
Apps like Oxify Bundles bake progress bars into both the product page and the cart drawer. The cart drawer placement is especially powerful — the customer is already in buying mode, one number from the next savings tier.
7. Show Savings in Both Percent AND Dollars
Different shoppers respond to different framing. "20% off" lands harder for cost-conscious buyers thinking in proportions. "Save $14" lands harder for buyers thinking in absolute dollars (especially at higher price points).
Show both, always:
| Tier | Per Unit | % Off | $ Saved |
|---|---|---|---|
| Buy 2 | $22.50 | 10% off | Save $5 |
| Buy 3 | $21.25 | 15% off | Save $11.25 |
| Buy 5 | $20.00 | 20% off | Save $25 |
For high-ticket items ($100+): Lean harder on dollar amounts than percentages. "Save $40" is more visceral than "10% off" on a $400 purchase, even though they're identical.
8. Place Tiers Above the Add-to-Cart Button
Sounds obvious. Most stores get it wrong.
The pricing table belongs in the buy box — the cluster of elements around the price, variants, and add-to-cart button. Specifically:
- Product price
- Variant selector (size, color, flavor)
- Quantity break pricing table ← here
- Quantity selector
- Add-to-cart button
On mobile, the pricing table needs to fit within the first viewport without scrolling. Test at 375px width using Chrome DevTools. If your tier table is below the fold, you're losing the majority of your traffic to one-unit conversions.
9. Layer in Urgency Without Being Tacky
Urgency isn't a fake countdown timer that resets when you refresh the page. That's worse than no urgency — it actively destroys trust.
Real urgency comes from real constraints:
- Real promotion windows. "Quantity break ends Sunday 11:59 PM" with an actual end date.
- Inventory scarcity. "Only 12 left at this tier price."
- Seasonal framing. "Holiday savings — through December 24."
- Customer-specific urgency. "New customer offer — apply by checkout."
Stack one urgency mechanic — not three. Layering "ends in 4 hours" + "only 12 left" + "ends Sunday" creates noise, not pressure. Pick the most credible signal for your customer.
10. Open Mix-and-Match Across Variants
If your product has variants (sizes, colors, flavors), forcing customers to buy 3 of the same SKU shrinks the funnel. A customer who'd happily buy two of size M and one of size L is now blocked.
Mix-and-match quantity breaks let customers combine variants toward a single tier. The discount applies across the cart, not just within a single variant.
This is especially powerful for:
- Apparel. Customers want different sizes for themselves vs. partners.
- Skincare and supplements. Different flavors, scents, or formulations.
- Coffee, tea, and consumables. Variety-pack demand.
- Build-your-own gift sets. Customers curate without leaving the product page.
Most modern bundle apps support mix-and-match. If yours doesn't, you're forcing customers into single-SKU orders that don't match how they actually shop.
11. A/B Test the Tier Structure (Not Just the Discount)
Most stores A/B test discount percentages. "Does 15% off convert better than 20%?" That's fine, but it misses the bigger lever.
The variables that move quantity break performance the most:
- Entry threshold — Buy 2 vs. Buy 3 as tier 1
- Top tier quantity — Buy 5 vs. Buy 10 as the aspirational tier
- Badge placement — "Most Popular" on tier 2 vs. tier 3
- Discount ramp — 10/15/20% vs. 10/20/30% vs. 15/20/25%
- Framing — Per-unit price vs. total price vs. % savings as the dominant number
How to run the test properly
- Run each variant for at least 14 days or 200 transactions per arm — whichever is longer
- Don't call winners with fewer than 100 conversions per arm — basket sizes are noisy
- Track revenue per visitor (RPV), not just conversion rate or AOV in isolation
- Test one variable at a time — multi-variable tests need 4–8 weeks per cycle
The Margin Math: Don't Skip This
A quantity break that lifts AOV but destroys margin is a worse outcome than no quantity break at all. Run the math before launching.
The formula
For each tier, the per-unit profit after the discount must remain above your contribution-margin floor:
| Variable | Example |
|---|---|
| Selling price (post-discount) | $22.50 |
| COGS (cost of goods) | $8.00 |
| Shipping per unit (at scale) | $3.00 |
| Payment processing (2.9% + $0.30) | $0.95 |
| Fulfillment / packaging | $1.50 |
| Ad spend allocation per unit | $3.00 |
| Net profit per unit | $6.05 |
If net profit per unit at the tier price stays positive (and ideally above 15% of selling price), the tier is safe. If it slips negative or under 10%, raise the threshold, shrink the discount, or skip this product.
Quick gut check
Maximum safe discount = (Gross margin %) − 15 percentage points. If your gross margin is 40%, your top tier discount cap is roughly 25%. Above that, you're trading dollars for vanity AOV gains.
Use the Oxify Bundle Calculator to model tier economics including COGS, shipping, fees, ad spend, refunds, and overhead before going live.
Want the full break-even walkthrough, with a copy-paste margin table and worked examples? Read do quantity breaks hurt your profit?
Tier Templates by Industry (Copy These)
The right tier structure depends on what you sell and how customers shop the category. Use these as starting points and A/B test from there.
| Industry | Tier 1 | Tier 2 (Anchor) | Tier 3 | Notes |
|---|---|---|---|---|
| Supplements / vitamins | Buy 2, save 10% | Buy 3, save 15% | Buy 6, save 25% | Pair with subscribe & save |
| Coffee / tea | Buy 2, save 10% | Buy 3, save 15% | Buy 5, save 22% | Mix-and-match flavors |
| Skincare / beauty | Buy 2, save 12% | Buy 3, save 18% | Buy 4 + free gift | Reciprocity at top tier |
| Apparel basics | Buy 3, save 15% | Buy 5, save 20% | Buy 10, save 30% | Mix sizes/colors |
| Pet products | Buy 2, save 10% | Buy 3, save 15% | Buy 5, save 22% | Subscribe & save bundled |
| Gift / seasonal | Buy 2, save 10% | Buy 4, save 20% + gift wrap | Buy 6, save 25% | Limited-time framing |
| Digital / POD | Buy 2, save 15% | Buy 5, save 30% | Buy 10, save 40% | Marginal cost ≈ 0 |
| B2B / wholesale | 10+ units, save 12% | 25+ units, save 18% | 50+ units, save 25% | Incremental pricing OK |
| High-ticket (>$200) | Buy 2, save 5% | Buy 3, save 8% | Buy 5, save 12% | Dollar amounts > % |
Quantity Breaks vs Bundles vs BOGO vs Discount Codes
Quantity breaks are one of four common Shopify discount mechanics. Picking the right one (or stacking them) depends on your goal.
| Mechanic | What It Does | Best For | Typical AOV Lift |
|---|---|---|---|
| Quantity Breaks | Tiered discounts on the same product | Consumables, basics, repeat purchases | +20–35% |
| Bundles | Fixed price for a bundle of different products | Cross-selling, gift sets, starter packs | +12–25% |
| BOGO / Buy X Get Y | Free or discounted unit when buying others | Inventory clearance, flash promotions | +15–30% |
| Discount Codes | Manual % or $ off at checkout | Email campaigns, influencer codes | +5–12% |
Why quantity breaks win for AOV: they scale across SKUs without manual setup, display on the product page (driving the upsell before cart), and stack cleanly with free-shipping thresholds and free gifts. Bundles and BOGO are powerful complements — not substitutes. Torn between the two big ones? Our quantity breaks vs bundles decision guide settles it product by product.
5 Mistakes That Kill Quantity Break Sales
- Setting discounts too steep. A 40% discount on a 30% margin product means you're losing money on every extra unit. Run the margin math (above) before going live.
- Putting the table below the add-to-cart button. If shoppers don't see the tiers in the first viewport, they bought one unit before they knew the tiers existed.
- No visual hierarchy. Three identical-looking tiers default the shopper to tier 1. Badge the target. Make it impossible to miss.
- Static, set-and-forget tiers. Your basket data changes. Your tiers should too. Audit them every 60 days.
- Forgetting mobile. If your pricing table breaks on 375px width, you're losing 70% of traffic. Test on a real phone — not just dev tools.
How to Measure If Quantity Breaks Are Working
"AOV went up" isn't enough. AOV can rise while total revenue falls if your conversion rate craters. Watch all four metrics together:
| Metric | What It Tells You | "Good" Looks Like |
|---|---|---|
| AOV (Average Order Value) | Whether shoppers are upgrading tiers | +15–35% within 30 days |
| Conversion Rate | Whether the tier table is adding friction | Flat or up 3–8% |
| Revenue per Visitor (RPV) | True bottom-line: AOV × CVR | +10–25% |
| Tier Selection Rate | Which tier shoppers actually pick | Target tier captures 40–55% |
| Gross Margin % | Whether the discount is sustainable | Flat or within 2pp of pre-launch |
If AOV is up but RPV is flat, your tier table is shifting buyers without growing the pie — usually a sign tiers are too steep and you're cannibalizing single-unit sales.
If RPV is up but tier 1 captures 80% of multi-unit orders, your middle tier isn't doing enough work. Raise tier 1's threshold or sweeten tier 2's incentive.
Real Merchant Results
Theory is one thing. Numbers are another. Here's what Shopify merchants report after implementing the strategies above:
| Merchant | Category | Result | What They Did |
|---|---|---|---|
| Go Ayurveda Dhanvantri | Supplements | +25% AOV | 3 tiers, anchor badge on middle tier, free shipping at top tier |
| Gudslip (Spain) | Accessories | AOV €20 → €70 (+250%) | Mix-and-match, design-controlled widget, urgency framing |
| Kattam | Fashion | Immediate sales lift | Fast setup, mobile-first placement, A/B tested badges |
The pattern: nobody hits a 30%+ AOV lift from a default tier table. They get there by stacking 3–5 of the strategies above and iterating on basket data for 30–60 days.
Tools to Set This Up in 10 Minutes
You don't need a developer to implement any of this. The right Shopify app handles tier display, discount logic, free shipping triggers, free gifts, progress bars, and A/B testing in one widget.
Apps that support the full playbook in this guide (verified May 2026):
- Oxify Bundles Quantity Breaks — Built for Shopify, no revenue commission, includes A/B testing, progress bars, free gifts, mix-and-match, and subscriptions.
- Kaching Bundles — Strong A/B testing, free plan capped at $1K bundle revenue.
- Wide Bundles — Design-heavy customization, revenue-based pricing.
For a full comparison of 10 quantity break apps with verified pricing, pros, cons, and setup tips, see our best quantity break apps for Shopify guide.
Frequently Asked Questions
How do quantity breaks increase sales?
Quantity breaks increase sales by offering a lower per-unit price as customers buy more, which lifts average order value 20–35% on most Shopify stores and up to 68% on consumables. They work by activating five psychology levers — perceived value, loss aversion, completion bias, choice architecture, and status signaling — all at once on the product page.
How much can quantity breaks realistically increase sales?
Most Shopify stores see a 20–35% lift in average order value within the first month. Consumables and basics often see higher lifts because customers already plan to reorder. Aggressive tier structures on digital products can push AOV gains above 50%, with consumable categories reaching 68% in 2026 industry data.
What is the best quantity break structure for Shopify?
The most tested structure is three tiers with a 10% / 15% / 20% discount ramp — entry tier at one unit above the typical basket size, middle tier badged "Most Popular," and an aspirational top tier that anchors the middle. This setup typically converts 40–55% of multi-unit buyers into the target middle tier.
Will quantity breaks hurt my conversion rate?
Done right, no — visible pricing tables typically lift conversion 3–8%. Done wrong (steep tiers, hidden tables, mobile-broken widgets), they add friction and reduce conversion. Place the table above add-to-cart and start tiers at the customer's natural buy quantity.
What is the best discount percentage for the first tier?
Start at 10%. Anything lower feels meaningless; anything higher than 20% trains customers to wait for the deal. Then step up by 5% per tier — 10% / 15% / 20% is the most-tested ramp.
Should the entry tier start at quantity 2 or quantity 3?
Look at your data. If your current AOV is one unit, start at quantity 2 — the easiest upgrade. If most orders are already 2 units, start at quantity 3. The first tier should require one extra unit beyond what shoppers already buy.
Can quantity breaks work for high-ticket products?
Yes, but the tier ramp is gentler. For a $200+ product, 5–10% discounts move the needle without destroying margin. Use absolute dollar savings ($20 off) rather than percentages — high-ticket shoppers respond more to dollar amounts.
How do I avoid cannibalizing single-unit sales?
Keep tier 1's discount modest (10%) and make customers earn it by adding a unit. Run the margin math: a 10% discount on a single extra unit usually nets more profit than the lost single-unit margin. If you see margin erosion, raise the threshold or shrink the percentage.
Do quantity breaks work alongside discount codes?
It depends on the app's discount method. Apps built on Shopify Functions stack with discount codes at checkout. Apps using Shopify's automatic discounts compete with codes (only one applies). Pick a Functions-based app if stacking matters.
How long should I A/B test quantity break tiers?
At least 14 days or 200 transactions per variant — whichever comes later. Quantity break tests run noisy because basket sizes vary widely. Don't declare a winner under 100 conversions per arm.
Where should the pricing table go on the product page?
Inside the buy box, below the variant selector and above the add-to-cart button. On mobile (375px), the table must be visible without scrolling past the price. If shoppers have to scroll to find it, most won't see it.
Should I show quantity breaks on every product?
No. Apply them to products with 40%+ gross margin, natural multi-unit demand (consumables, basics, gifts), and price points above $15. Skip them on loss leaders, complex-fit items, or one-and-done luxury purchases.
What is the difference between quantity breaks, bundles, and BOGO?
Quantity breaks discount the same product bought in multiples (Buy 3, save 15%). Bundles combine different products at a fixed package price (Item A + B + C, save 20%). BOGO gives away a unit at no cost (Buy 1, get 1 free). All three lift AOV — quantity breaks scale best across SKUs without manual setup.
Sources & Further Reading
- Shopify Future of Commerce Report — consumer expectations around bulk pricing
- Shopify Pricing Strategies — tiered vs. flat pricing studies
- Oxify Bundles Quantity Breaks — Shopify App Store
- Best Quantity Break Apps for Shopify (2026) — comparison of 10 apps
- Oxify Bundle Calculator — model tier economics